


FMEA, FMECA
Failure Analysis & Troubleshooting
A FMECA ("Failure Mode Effects Criticality Analysis") consists of an outlining of
all of the possible Failure Modes of all elements in a system, and a determination
of the Effects and Criticality of these failure modes. This analysis looks at the
failure of each element within a device or system to determine the effect on the
end performance. The failure of an element may be simple or complex. As an example,
a resistor has three failure modes. The resistor could be open, shorted, or outside
of its specified tolerance. An integrated circuit is obviously much more complex.
The goal is to eliminate any single-point failures that would cause the system to
fail to meet its performance requirements. Another way to look at this is to validate
that a “graceful” degradation of a device or system will take place over time.
As a further example, suppose that the input to a device or system is coupled to
the outside world, via a resistor. If the resistor were to open, there would be
no output from the device or system. The effect is, therefore, non-performance,
the criticality is very high, and this constitutes a single-point failure. The goal
is to minimize the likelihood of single-point failures and to provide the greatest
amount of graceful degradation.
This analysis is performed using specialized computer software, along with SPICE
and other mathematical models of the system.
The FMECA begins with a stress-based reliability (MTBF) analysis. This generates
the failure rate of each of the components. Each component in the BOM is assigned
a set of failure modes. These are normally defined using MIL-HDBK-338B which has
a definition of the common types of failures for each type of component along with
the probability (Mode Failure percentage) of each failure mode occurring. For example:
Open 30%, Short 30%, out of tolerance 40%.
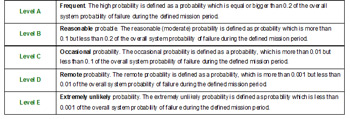
Next, each failure mode is analyzed for its local, next higher assembly, and system
level effect which will occur when the failure model happens as shown below.
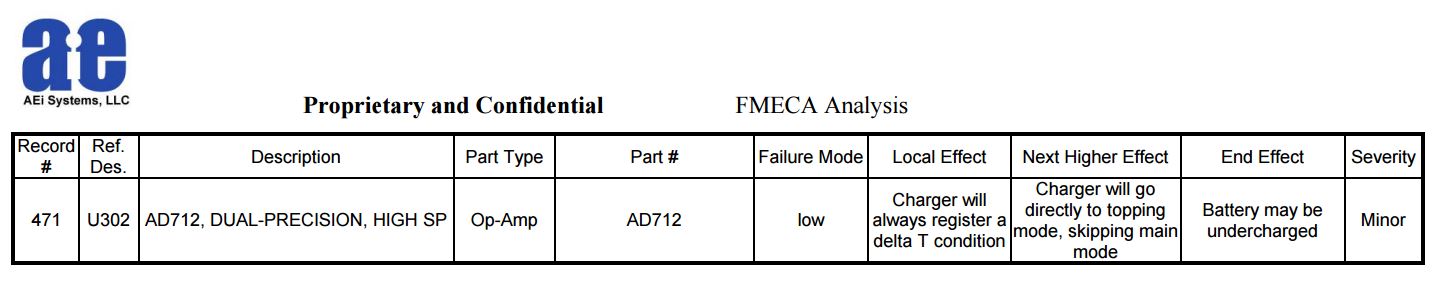
The failure mode is also assigned a severity classification.
Severity Type Description

The Mode criticality is then computed. Mode criticality is a numerical value that
can be assigned to each failure mode. Mode criticalities are based on the FMECA
approach defined in MIL-STD-1629 and other guides. The Mode Criticality is then
computed as:
Mode Criticality = Failure Effect Probability * Mode Failure Rate * Operating Time
of the System
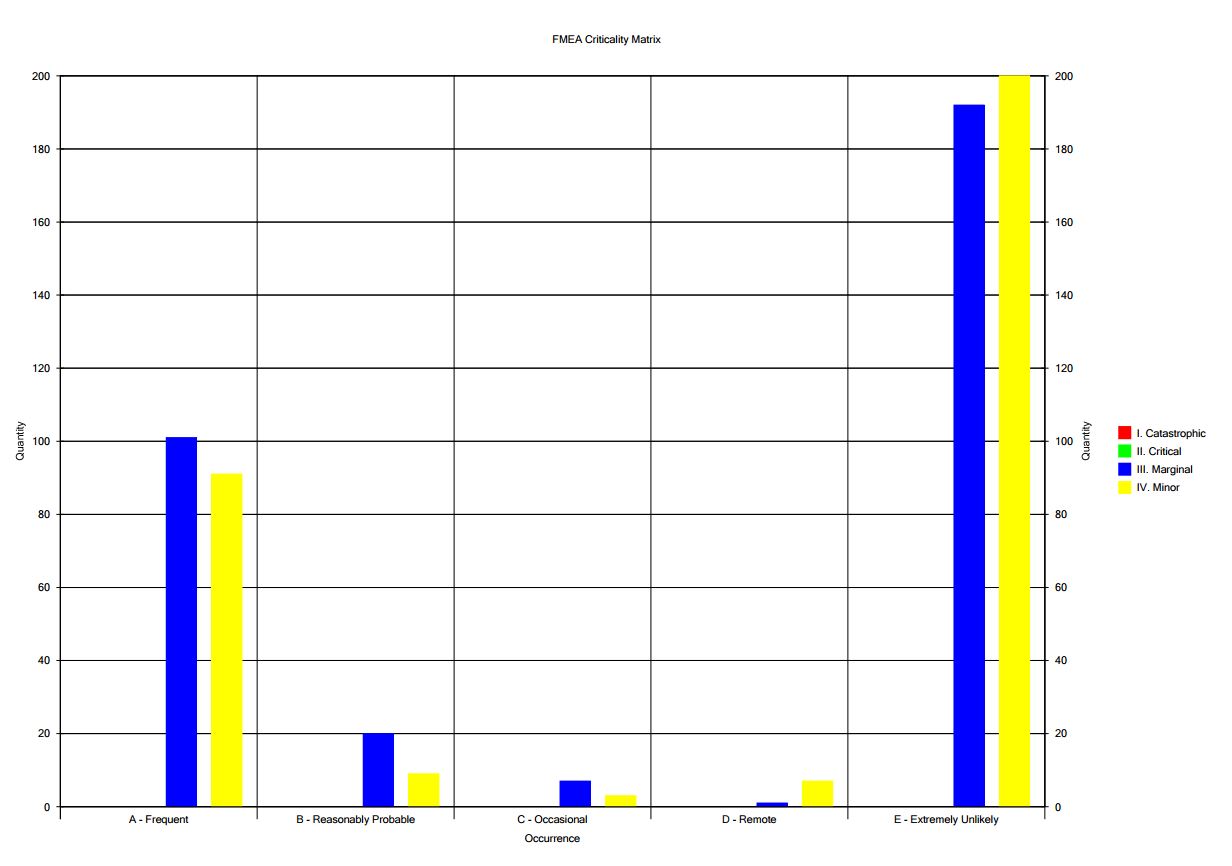
This is really the essence of the FMECA. The result is the ranking of the most critical
faults by the probability that they are most likely to occur -- the worst failure
mode offenders. The results are listed in a table or graphed as shown below.
Getting a Quotation
In order to provide a firm fixed quotation for a FMECA, we will need to see a schematic
of the design, a parts list (BOM), and a specification, if one exists.
Please let us know if a Non-Disclosure Agreement (NDA) needs to be put into place.
If so, please forward a Mutual NDA Form in MS Word Format to
lee@aeng.com. AEi Systems can also send its mutual form to you if that
is preferred.
Download the AEi Product Brochure
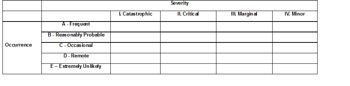
FMEA Mode Criticality Matrix
The difference between the FMEA and the FMECA is the criticality portion of the
analysis -- the assessment of the probability along with the severity. In fact, the
criticality represents the culmination of the analysis and much of the usefulness
in the analysis stems from this aspect.
• Assesses what happens to the system when components do fail
• Ranks parts by failure rate and how bad a failure would be
• MIL-STD-1629A/ECSS-Q-ST-30-02C Guidance
• BOMS Configured with Failure Modes for each part
• MIL-HDBK-338B Failure mode Probabilities
• Open, short, Change in Value
• Local, Next, and End Effects Compiled
• Severity Assigned
• FMECA Info Read into Relex
• Stress, Temperature, and Failure Rates applied
• Criticality and Risk Levels Computed
In order to provide a firm fixed quotation for a FMECA, we will need to see a schematic
of the design, a parts list (BOM), and a specification, if one exists.
Stress & Derating Analysis
A stress and derating analysis is a detailed accounting of the applicable voltage, current power and thermal stress
on each individual component within a device or system. Both nominal and worst case end of life stress calculations
are made, with the worst case results using EOL component tolerances, worst case environment, and worst case operating
conditions (input and loading). Transient stress conditions such as startup, current limit, short circuit, and other
fault conditions are also sometimes assessed.
The calculated quantities are compared against a set of derated component ratings. The nominal stress ratios (nominal
value/rating) are computed for use in the Reliability (MTBF) analysis. The derated stress ratios are also computed.
Most failures in a device or system are a direct result of subjecting components to some sort of overstress condition.
This analysis is typically performed by hand, and summarized in a spreadsheet format. SPICE models or other mathematical
models may be used to determine the applicable stress.
A single over-stressed component can cost your company millions of dollars. A thorough Stress & Derating Analysis can
prevent this from happening.
If you are going to perform one analysis to improve the reliability of your system, it should be a Stress & Derating
analysis.
Stress Guides Supported:
● LMCO - N2.3.5-T3-ElecEng-3.8, 817AY007502
● TOR
● SMC Standard SMC-S-010
● ECSS-Q-ST-30-11C
● EEE-INST-002
● RIAC
● MIL-Handbook-1547A/MIL-Std-1547B
● MIL-STD-975M
● MIL-P-11268
Here is a link to a sample Stress & Derating analysis report.
• Example Stress Analysis
Reliability Prediction - MTBF Analysis
AEi Systems performs parts-count and stress-based MTBF analyses. The results are
used to assess the potential component failure probabilities, and when the failures
may occur during the product’s lifetime. When combined with a stress analysis and
a FMECA analysis, these “part-based” analyses can be very effective in pinpointing
the soft spots in your design, allowing you to dramatically improve system quality.
While there are many guides that discuss reliability analyses, few discuss some
of the pitfalls with calculating and interpreting the results.
An "MTBF" analysis basically sums the failure rates of the parts in the BOM. The
analysis produces a single number for the systems MTBF, failure rate, and reliability.
Often, an MTBF analysis is done only to compute this number, which is used mainly
for marketing purposes. This is a less than optimum goal for two reasons: one, the
number as discussed below is suspect, and two, the most useful aspect of the analysis
goes unutilized.
The usefulness is marred by the variability of each part’s data. To get the failure
rate correct requires attention to various characteristics that impact the calculation,
any one of which can greatly change the result. A parts-count analysis is of limited
usefulness.
Here are some of the issues that AEi Systems takes into account. If you don’t, the
results for the SAME BOM can differ by several hundred percent.
• Calculation irregularities are commonly encountered
• Confidence Level (up to 2.5x difference between 60% & 90% derived FIT rates)
• Arrhenius translation between temperatures can be complicated
• MIL-Handbook-217 and Telcordia have a limited set of categories
• Is Stress Included in the MTBF computation?
• Are vendor FIT Rates used properly"
• MTBF doesn’t consider “out-of-spec” conditions
• Only considers “extreme” types of failures; results may not be useful to improving
reliability
Getting a Quotation
To provide a fixed firm quotation for an MTBF analysis, please forward a Bill of
Materials (“BOM”).
There are valuable reasons for performing this analysis such as identifying the
key reliability drivers, making MTBF comparisons with competitive products, and
selecting warranty periods. There are other results from the analyses (PI factors,
ranking of failure rates by category, part type, environment, stress level, etc.),
but none is more important than the ranking of the parts in the design by their
failure rate.
This is where the electrical designer can gain some insight into the design quality
and choose parts that will most improve reliability.
AEi Systems supports MIL-Handbook-217 and Telcordia Technical Reference TR-332.
Both standards have similar drawbacks to those listed above, though not to the same
degree or specificity. MIL-Handbook-217 tends to be for more high-reliability applications
(military, space), while Telcordia tends to be used more for commercial products.
To actually perform the analysis, you will need to provide the following Information:
• Assembly & subassembly structure (if there are multiple subassemblies)
• Which calculation model to use: Telcordia or MIL-HDBK-217
• Temperature(s) at which you want the results computed.
• Operational Duty Cycle (is the unit on all the time or does it cycle?)
• Burn-in time (of parts or the system)
• Expected Mission life, if known
• Environment (Ground Benign, Controlled, Space, etc.)
• Part Quality Levels (AEi Systems can help you figure these out)
Analysis | SPICE Modeling | Publications
Home | Services |
About Us | Contact Us | Jobs
Terms of Use | Site Map
©AEi Systems, Inc. All Rights Reserved.